Bifrost®: bibliometrics for quick and clear interpretation
Bifrost® is a tool for analysing research publications. It collects, analyses and presents information about publishing and collaboration, and is used by higher education institutions and researchers to gain a clearer picture of their research activity. More than 150 reports are currently publicly available at bifrost.kau.se.
What does Bifrost® do?
- Collects information:
- SwePub: Swedish research publications with subject classification according to UKÄ and information on open access status.
- DiVA: institution-specific publications, including doctoral and licentiate dissertations as well as information on individual researchers.
- OpenAlex: international publication data with broad coverage.
- Enriches data:
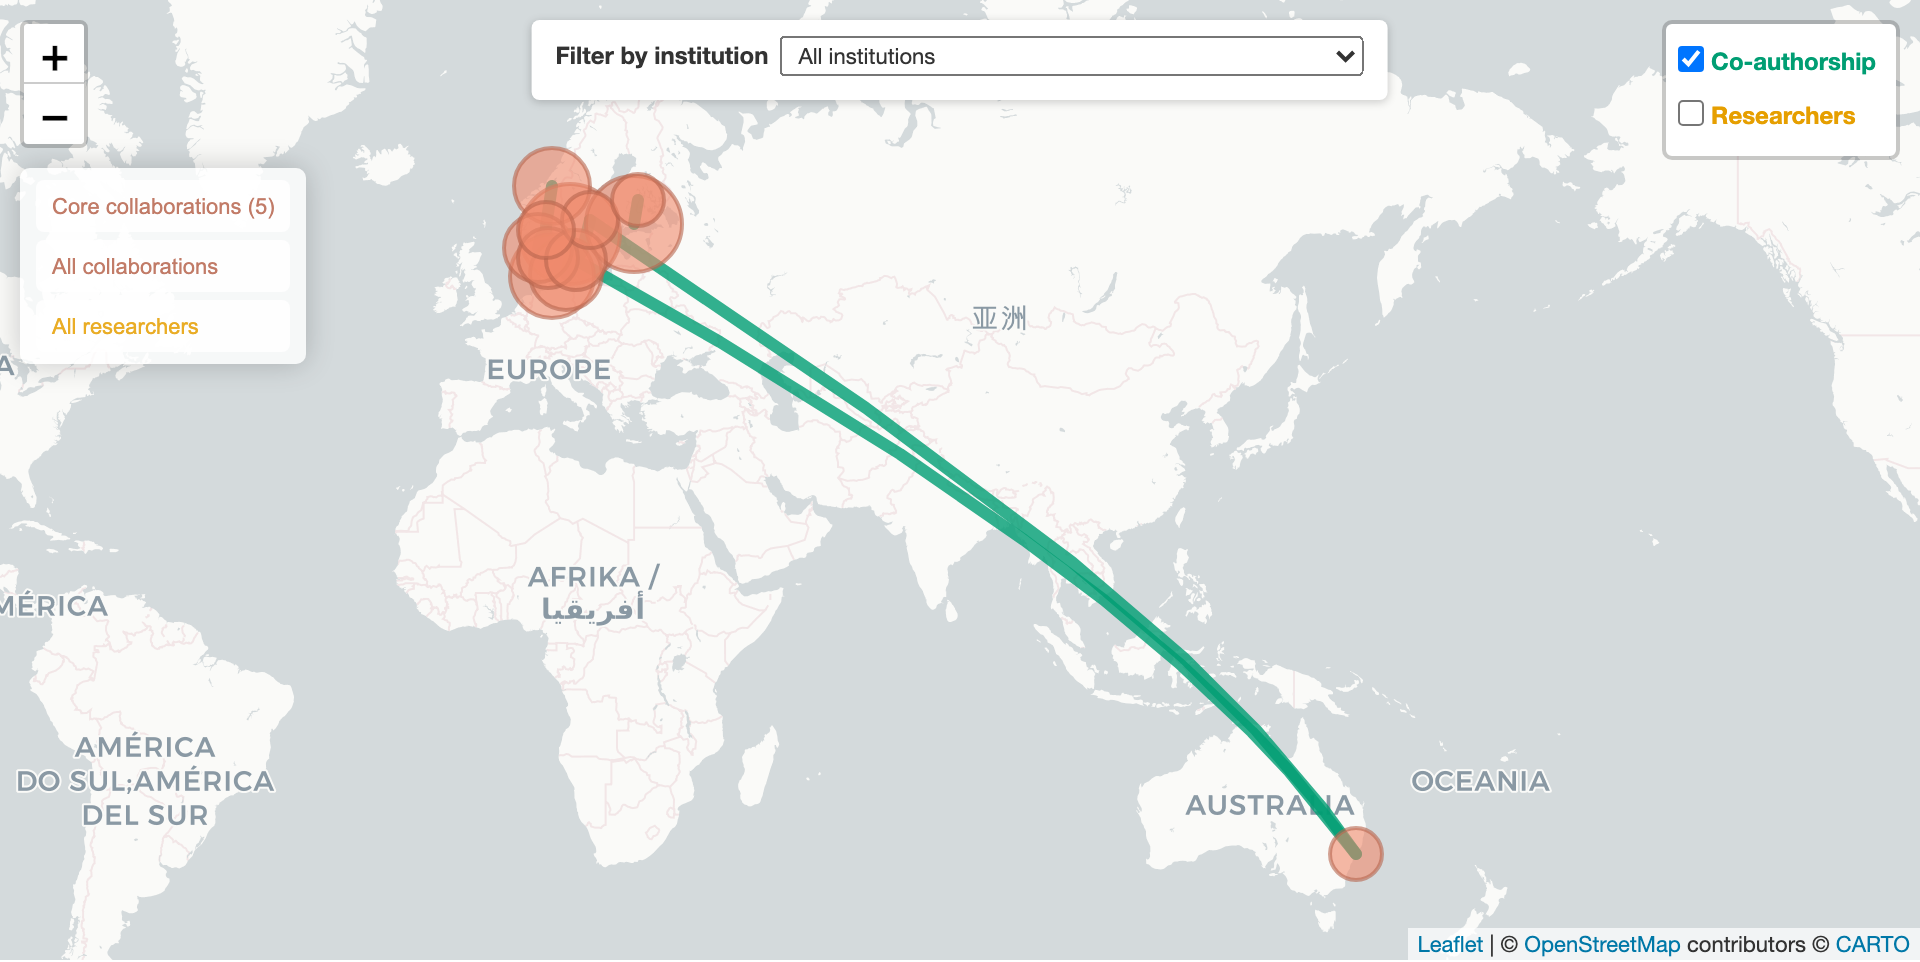
- OpenAlex: citations, open access status (via Unpaywall) and per-author geodata.
- NPI (Kanalregisteret): journals' quality level (1 or 2).
- SCImago (SJR): journals' international quartile ranking.
- Analyses and compiles data:
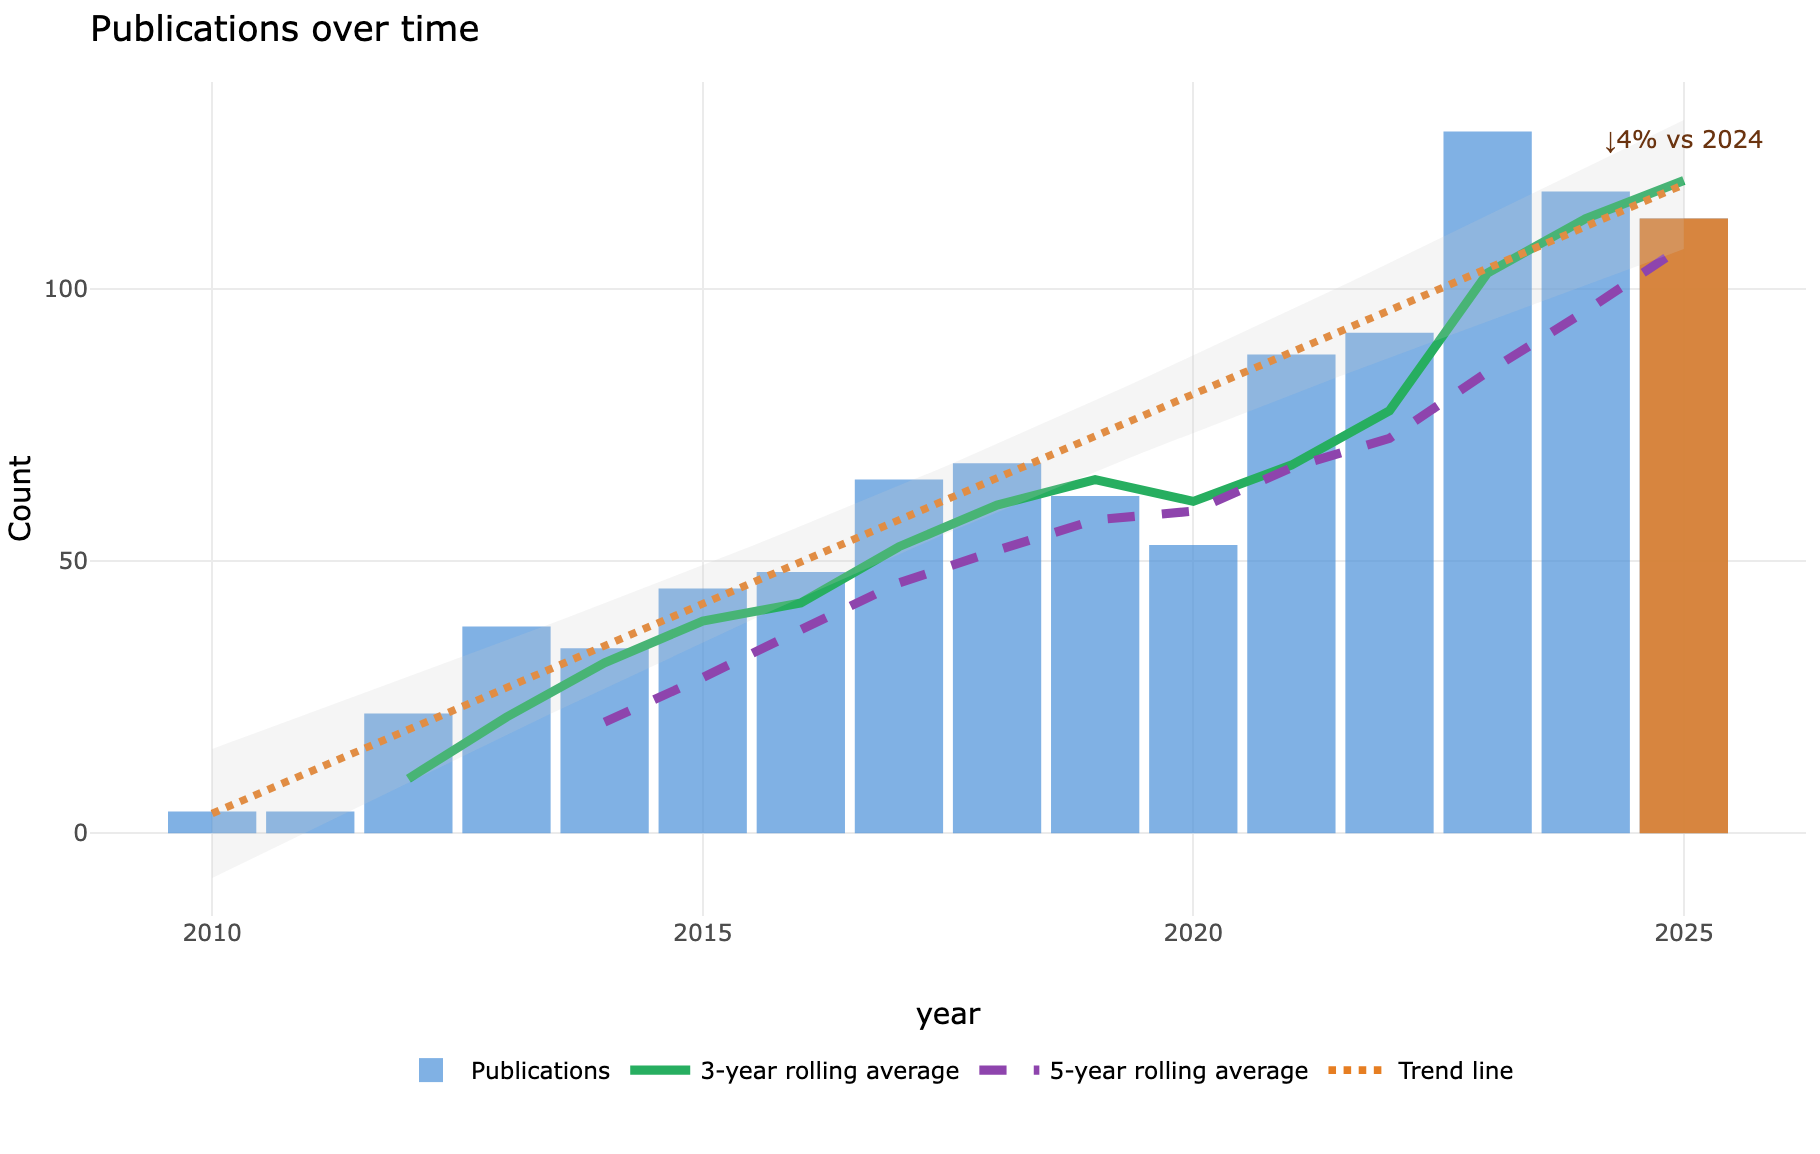
- Publication trends over time, including growth rates and detection of subject bursts.
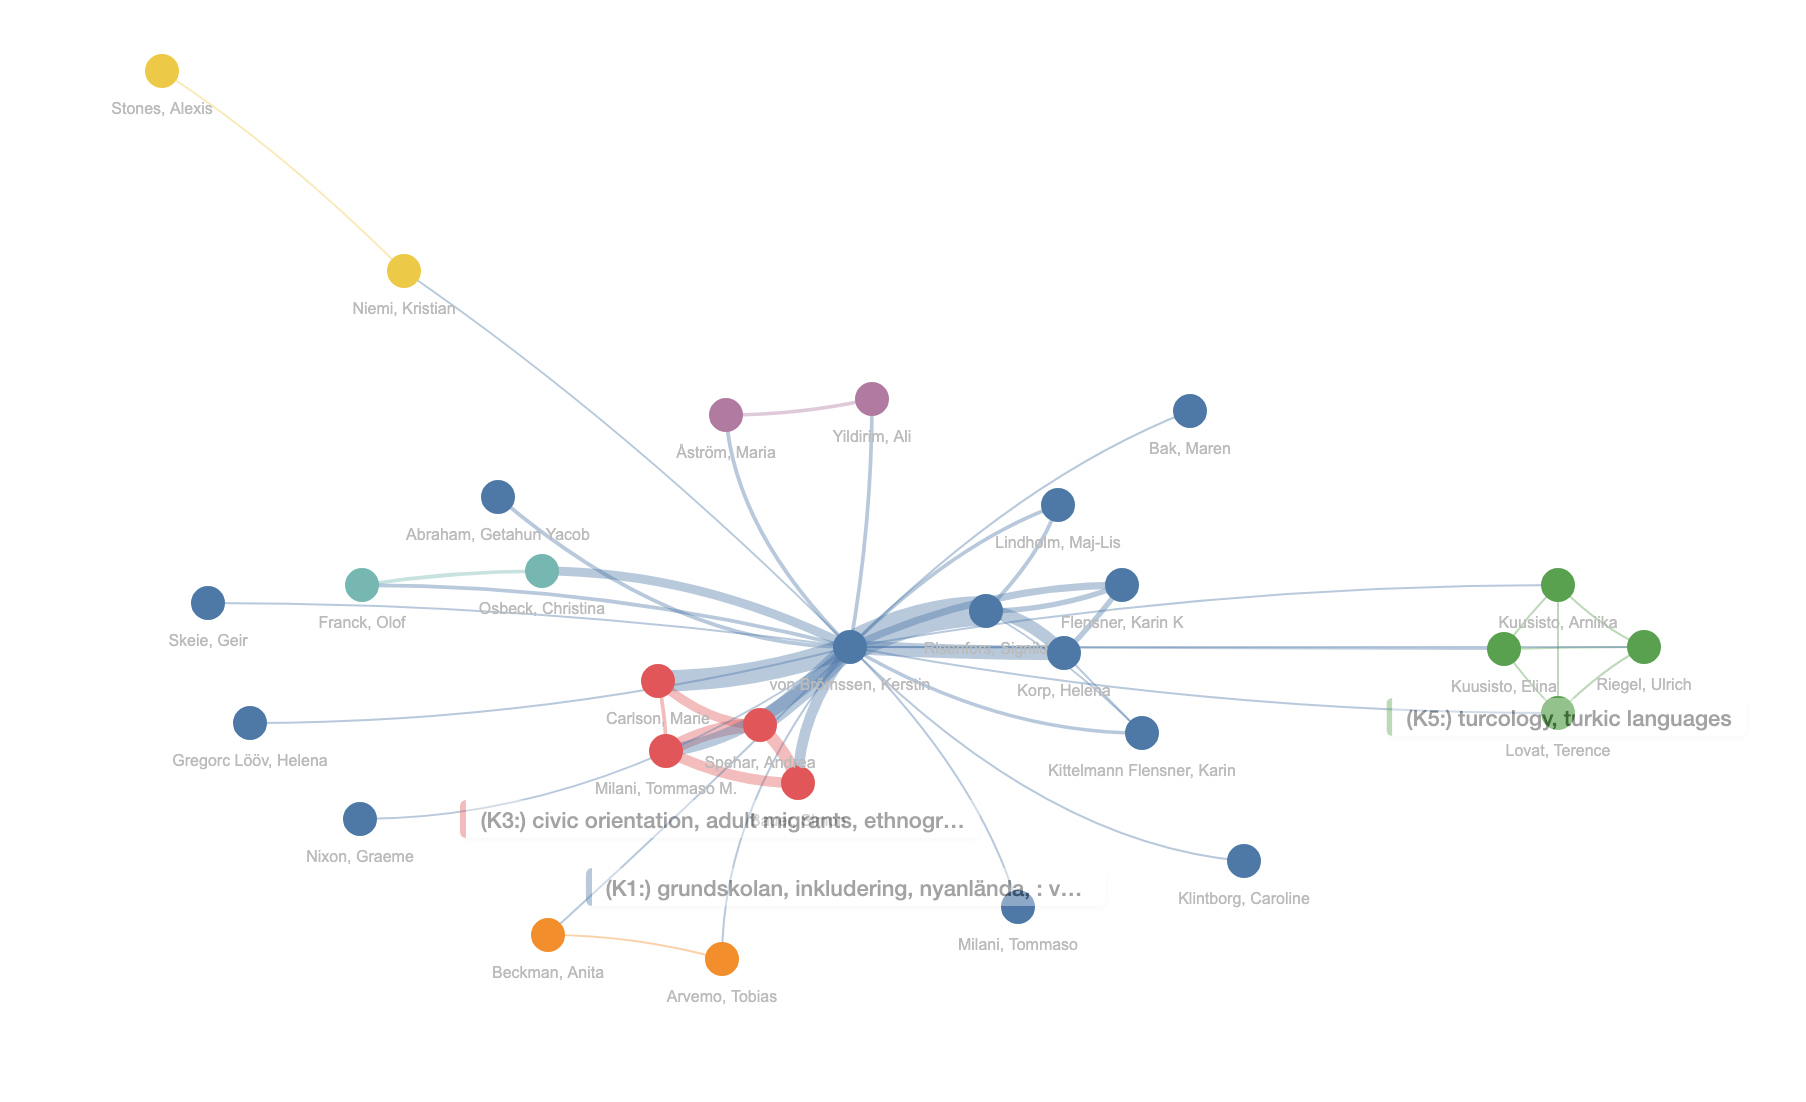
- Co-authorship networks: who collaborates with whom, internally and externally.
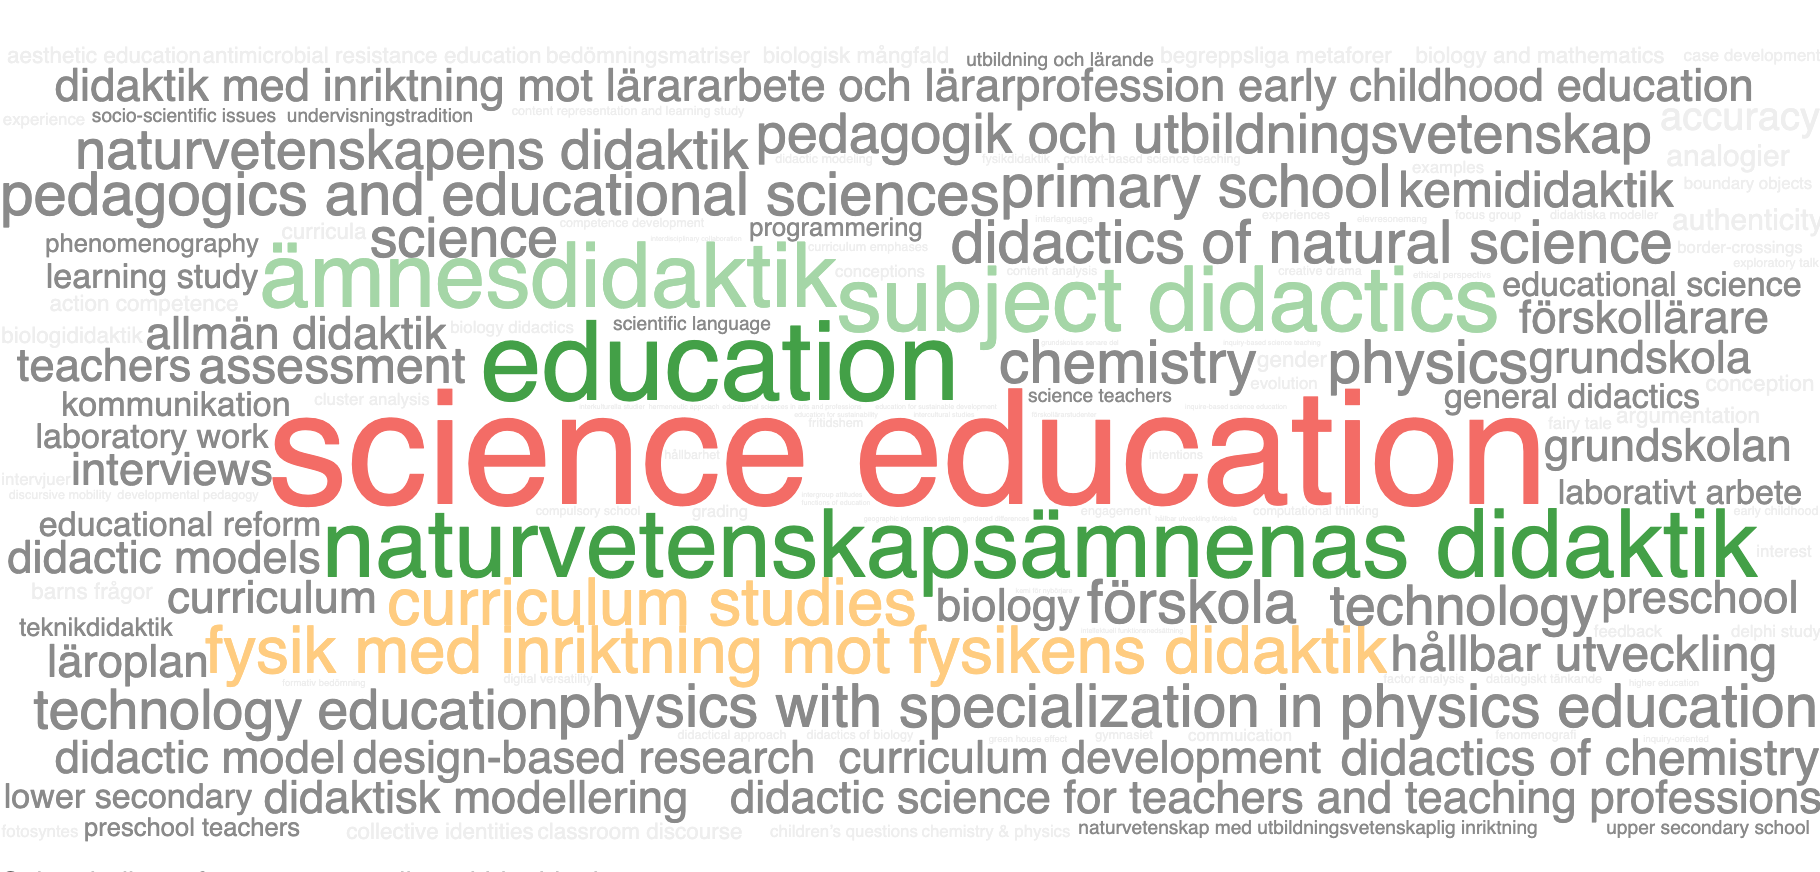
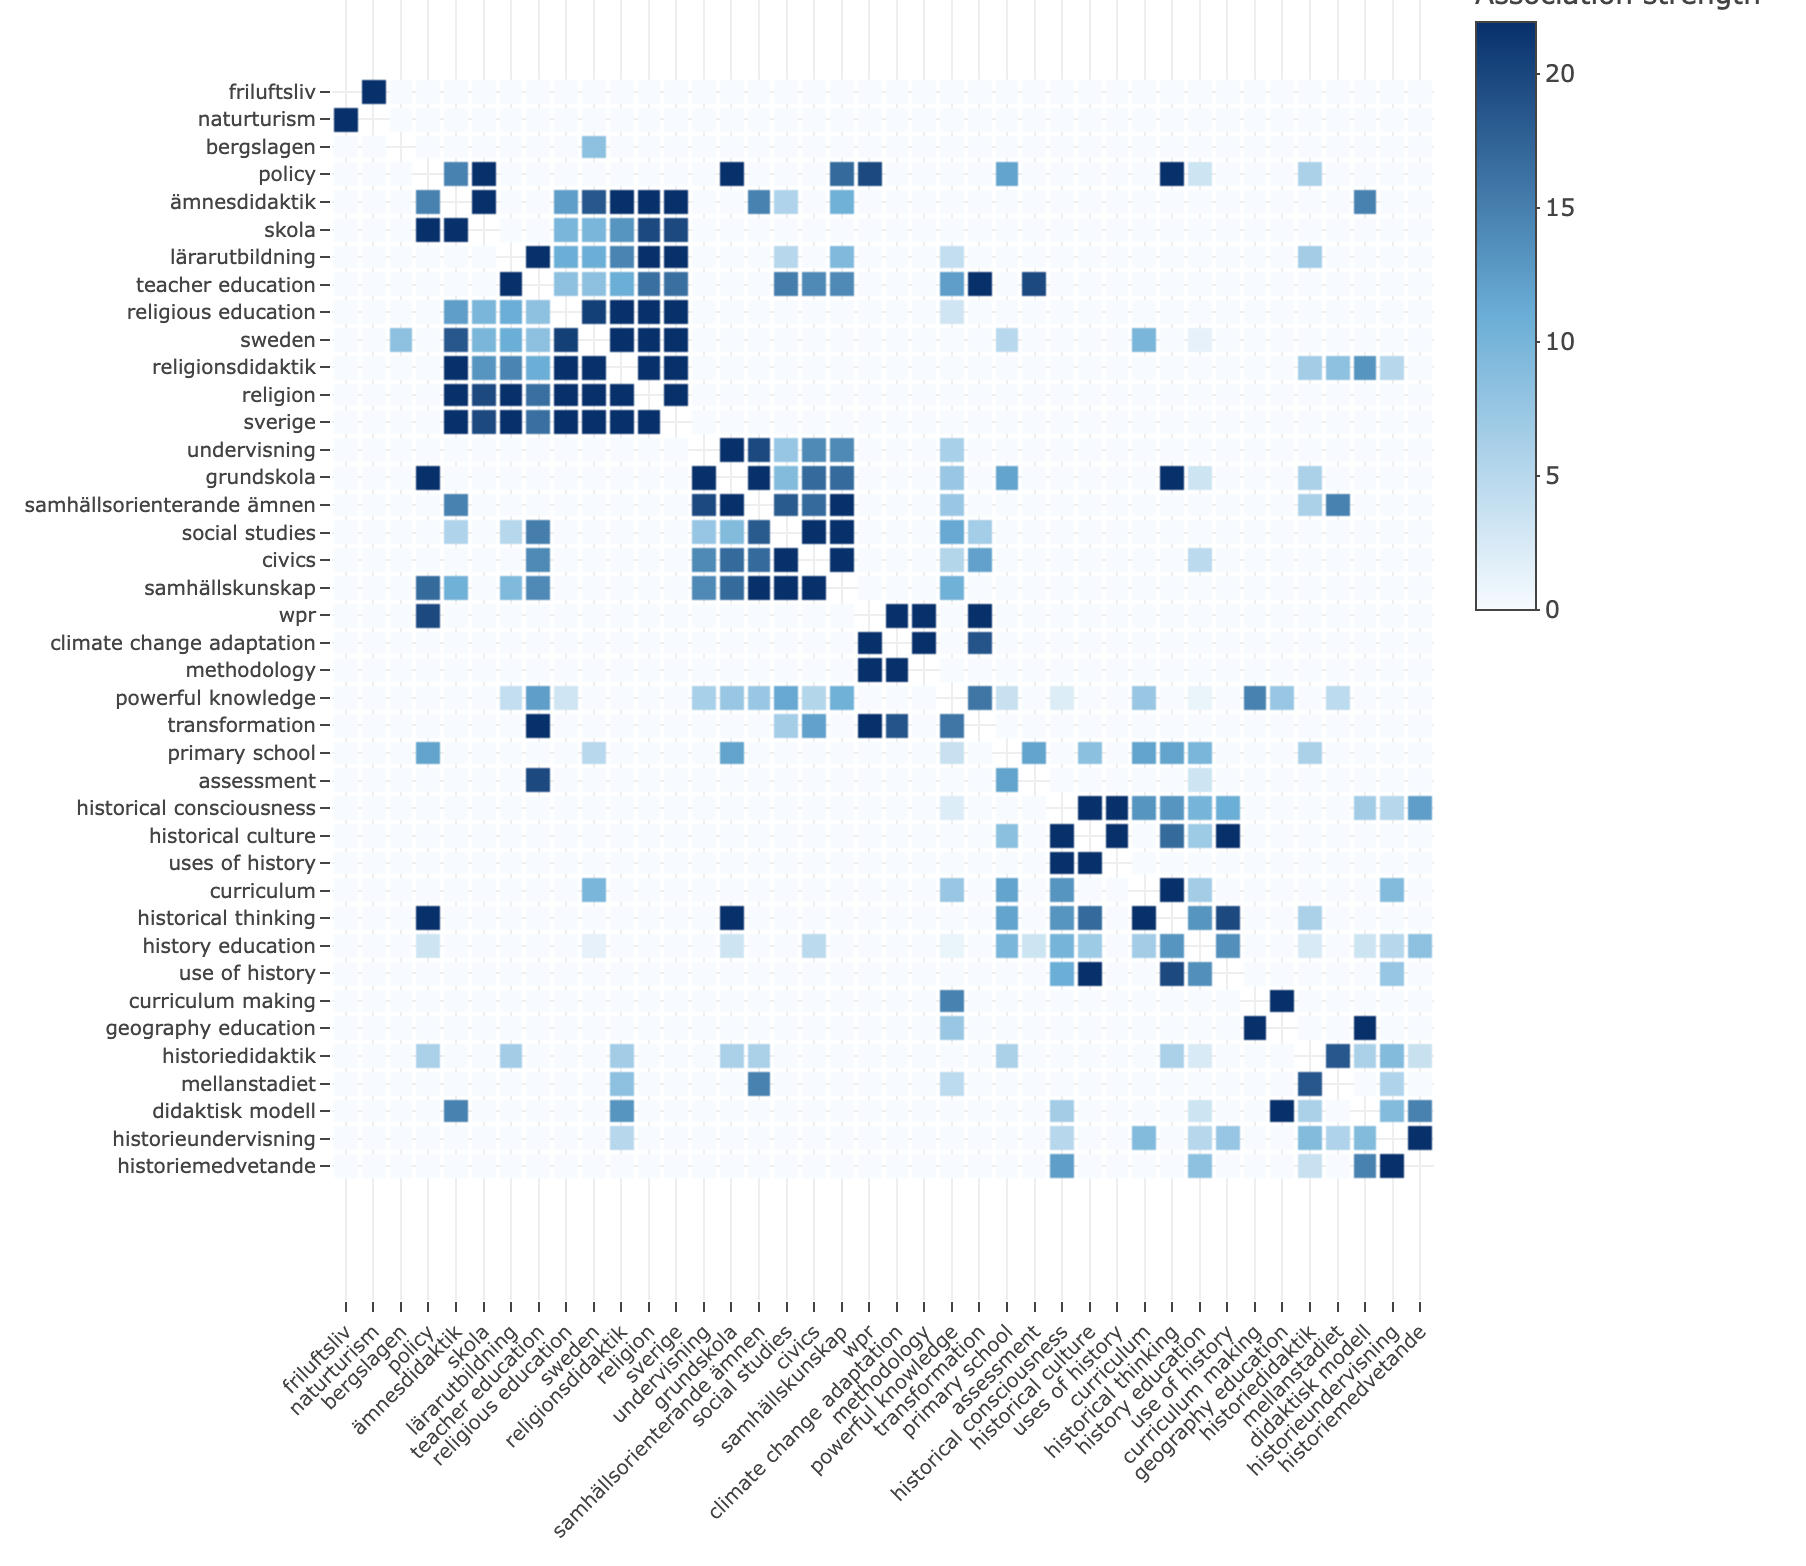
- Subject and keyword analysis with visualisation of co-occurrences.
- Journal profiles based on NPI level and SJR quartile.
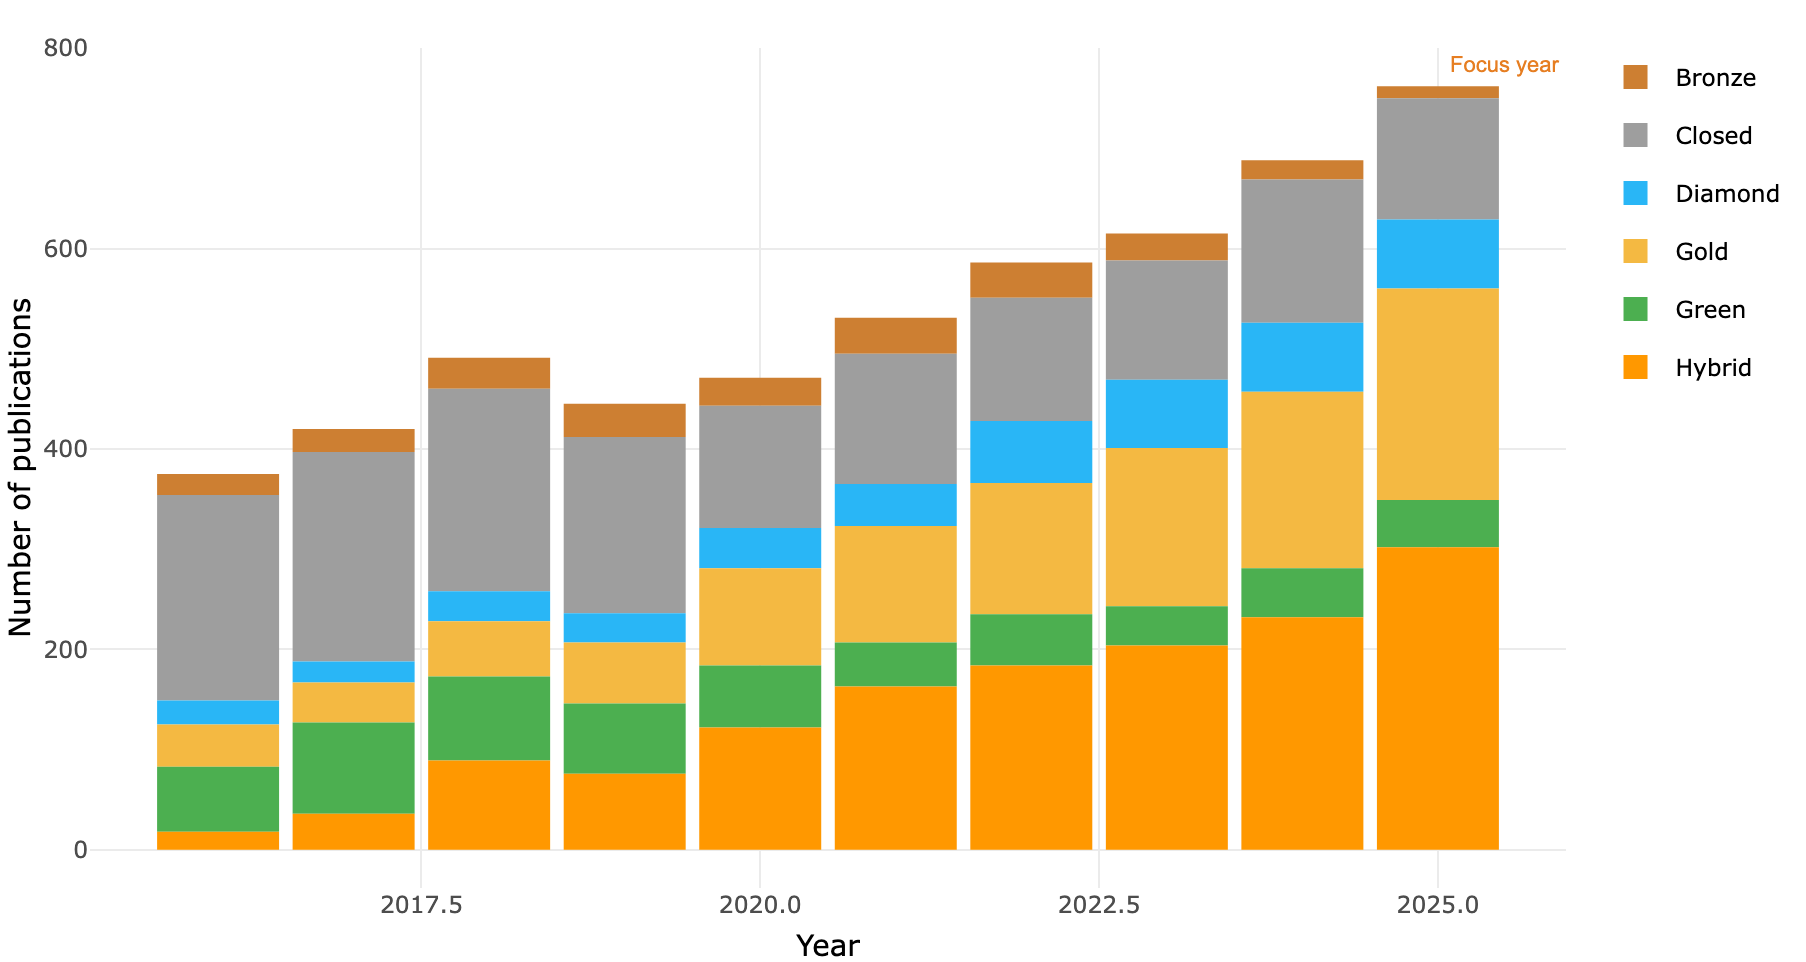
- Open access status per publication type.
- Citation data and FWCI (Field-Weighted Citation Impact, a field-normalised citation metric; read more here).
- Presents the results:
- Generates interactive HTML reports with tables, charts and networks that can be shared and used directly in the browser, with no special software required.
- Whole reports can also be exported as PDF for archiving or printing.
- Publication lists can be downloaded in RIS and BibTeX format for import into reference managers (e.g. Zotero, EndNote, Mendeley).
- Tables and publication lists can be downloaded as Excel files for further processing.
- Reports can serve as a basis for research overviews, strategic decisions and evaluations.
Why use Bifrost®?
- Overview: Get a clear picture of research activity.
- Insight: Identify trends and successful research areas.
- Efficiency: Saves time through automated processes.
Bifrost® makes it easier to understand and use bibliometric information.
For those who…
- …work as a librarian or bibliometrician. Bifrost provides in-depth analyses of publication patterns, open access share and collaboration structures in a single coherent report. Tables can be exported and the method is transparent. See Data sources and Method.
- …are a researcher or research group leader. Get a picture of your group's publishing, your most frequent collaboration partners and which subject areas you actually work within, based on your own publications.
- …sit in institutional management or are a head of department. Trend overviews and comparative material for strategic discussions. Which subject areas are growing? What does collaboration with external partners look like?
- …work as a research administrator. Structured compilations for annual reports and agency reporting. Tables with correct headings that can be exported directly to Excel.
- …are a doctoral student or interested in bibliometrics. Map a research field ahead of a literature review. See which keywords dominate, which journals publish the most and how the field has changed over time.
Examples
Bifrost produces reports for several different types of search. Which data source is used depends on the purpose: SwePub gives broad national coverage, DiVA is used for institution-specific analyses (dissertations, theses, person or organisation IDs), and OpenAlex for international coverage and citation analysis. See data sources for a full comparison, or more examples and descriptions.
- Subject searches, national (SwePub): Social studies education: maps a subject-didactic field, who publishes and how the field has developed.
- Subject searches, international (OpenAlex): Flooding in Earth and Related Environmental Sciences: maps a field globally, including citation data.
- Organisation searches: Centre for Social Science Didactics (2025): a research group's publication patterns and collaboration network, with focus-year analysis.
- Institution searches (DiVA): Karlstad University 2025: an overview of an entire institution's publishing, with focus-year analysis.
- Person searches: Kerstin von Brömssen: an individual researcher's publishing, collaborations and subject areas. (The analysis has also been published as a book chapter.)
- Journal profiles: Nordidactica: analysis of an individual journal's publications.
- Student theses: Student theses in social studies education at KAU (until 2025): subject mapping of thesis output.
Contact Kristian Niemi <kristian.niemi@kau.se> for more information!